

- National Australia Bank (“NAB”) is one of the nation’s largest business banks with international operations in in New Zealand, Asia, the UK, and the US.
- NAB delivered strong financial performance in 1H23. Net interest income and trading income surged, supporting pre-provision income.
- Credit profile remains solid given a positive earnings outlook, strong capital, and liquidity position while being sufficiently provisioned.
- We recommend NAB 5.000% 19Jan2032 Corp (AUD), NAB 6.322% 3Aug2032 Corp (AUD) and NAB 6.163% 09Mar2033 Corp (AUD).
About National Australia Bank
National Australia Bank (“NAB”) is one of the nation’s largest business banks with international operations in New Zealand, Asia, the UK, and the US. The bank operates mainly across four divisions:
- Business and Private Banking focuses on NAB's priority SME customer segments. This includes the NAB Business franchise, specialised Agriculture, Health, Government, Education and Community services, Private Banking, and JBWere.
- Personal Banking provides banking products and services to customers through its network of branches and ATMs, call centres, digital capabilities, proprietary lenders, and mortgage brokers.
- Corporate and Institutional Banking provides a range of products and services including client coverage, corporate finance, markets, asset servicing, transactional banking, and enterprise payments.
- New Zealand Business provides banking and financial services across customer segments in New Zealand. It includes the Wealth franchise operating under the ‘Bank of New Zealand’ brand.
In 2022, NAB also acquired Citigroup’s consumer business in Australia. Based on reported market share estimates from the Australian Prudential Regulation Authority (“APRA”), NAB holds a strong market share in Australia across business lending (21.6% of the banking system’s assets), consumer cards (25.7%), and home lending (14.7%).
All three major credit rating agencies have stable outlooks on the group, with ratings of ‘A+‘ by Fitch, ‘Aa3’ by Moody’s and ‘AA-‘ by Standard & Poor’s.
Financial Highlights
NAB delivered strong financial performance in the half year ended 31 March 2023 (1H23) with double-digit earnings growth (Chart 1). Statutory profit grew 18% half-on-half (“HoH”) from AUD $3,551M (2H22) to AUD $3,967M (1H23) while cash earnings grew 12% HoH from AUD $3,624M to AUD $4,070M (Chart 1), reflecting strong operating performance. Cash earnings is calculated by adjusting statutory net profit from continuing operations for non-cash earnings items.
Net operating income for the bank, driven by improvements in both net interest income and other operating income, rose 11% HoH from AUD $9,468M (2H22) to AUD $10,529M (1H23). Net interest income (“NII”) saw solid growth of 9% HoH given higher average lending volumes, led by the higher SME loans, and stronger net interest margin (“NIM”).
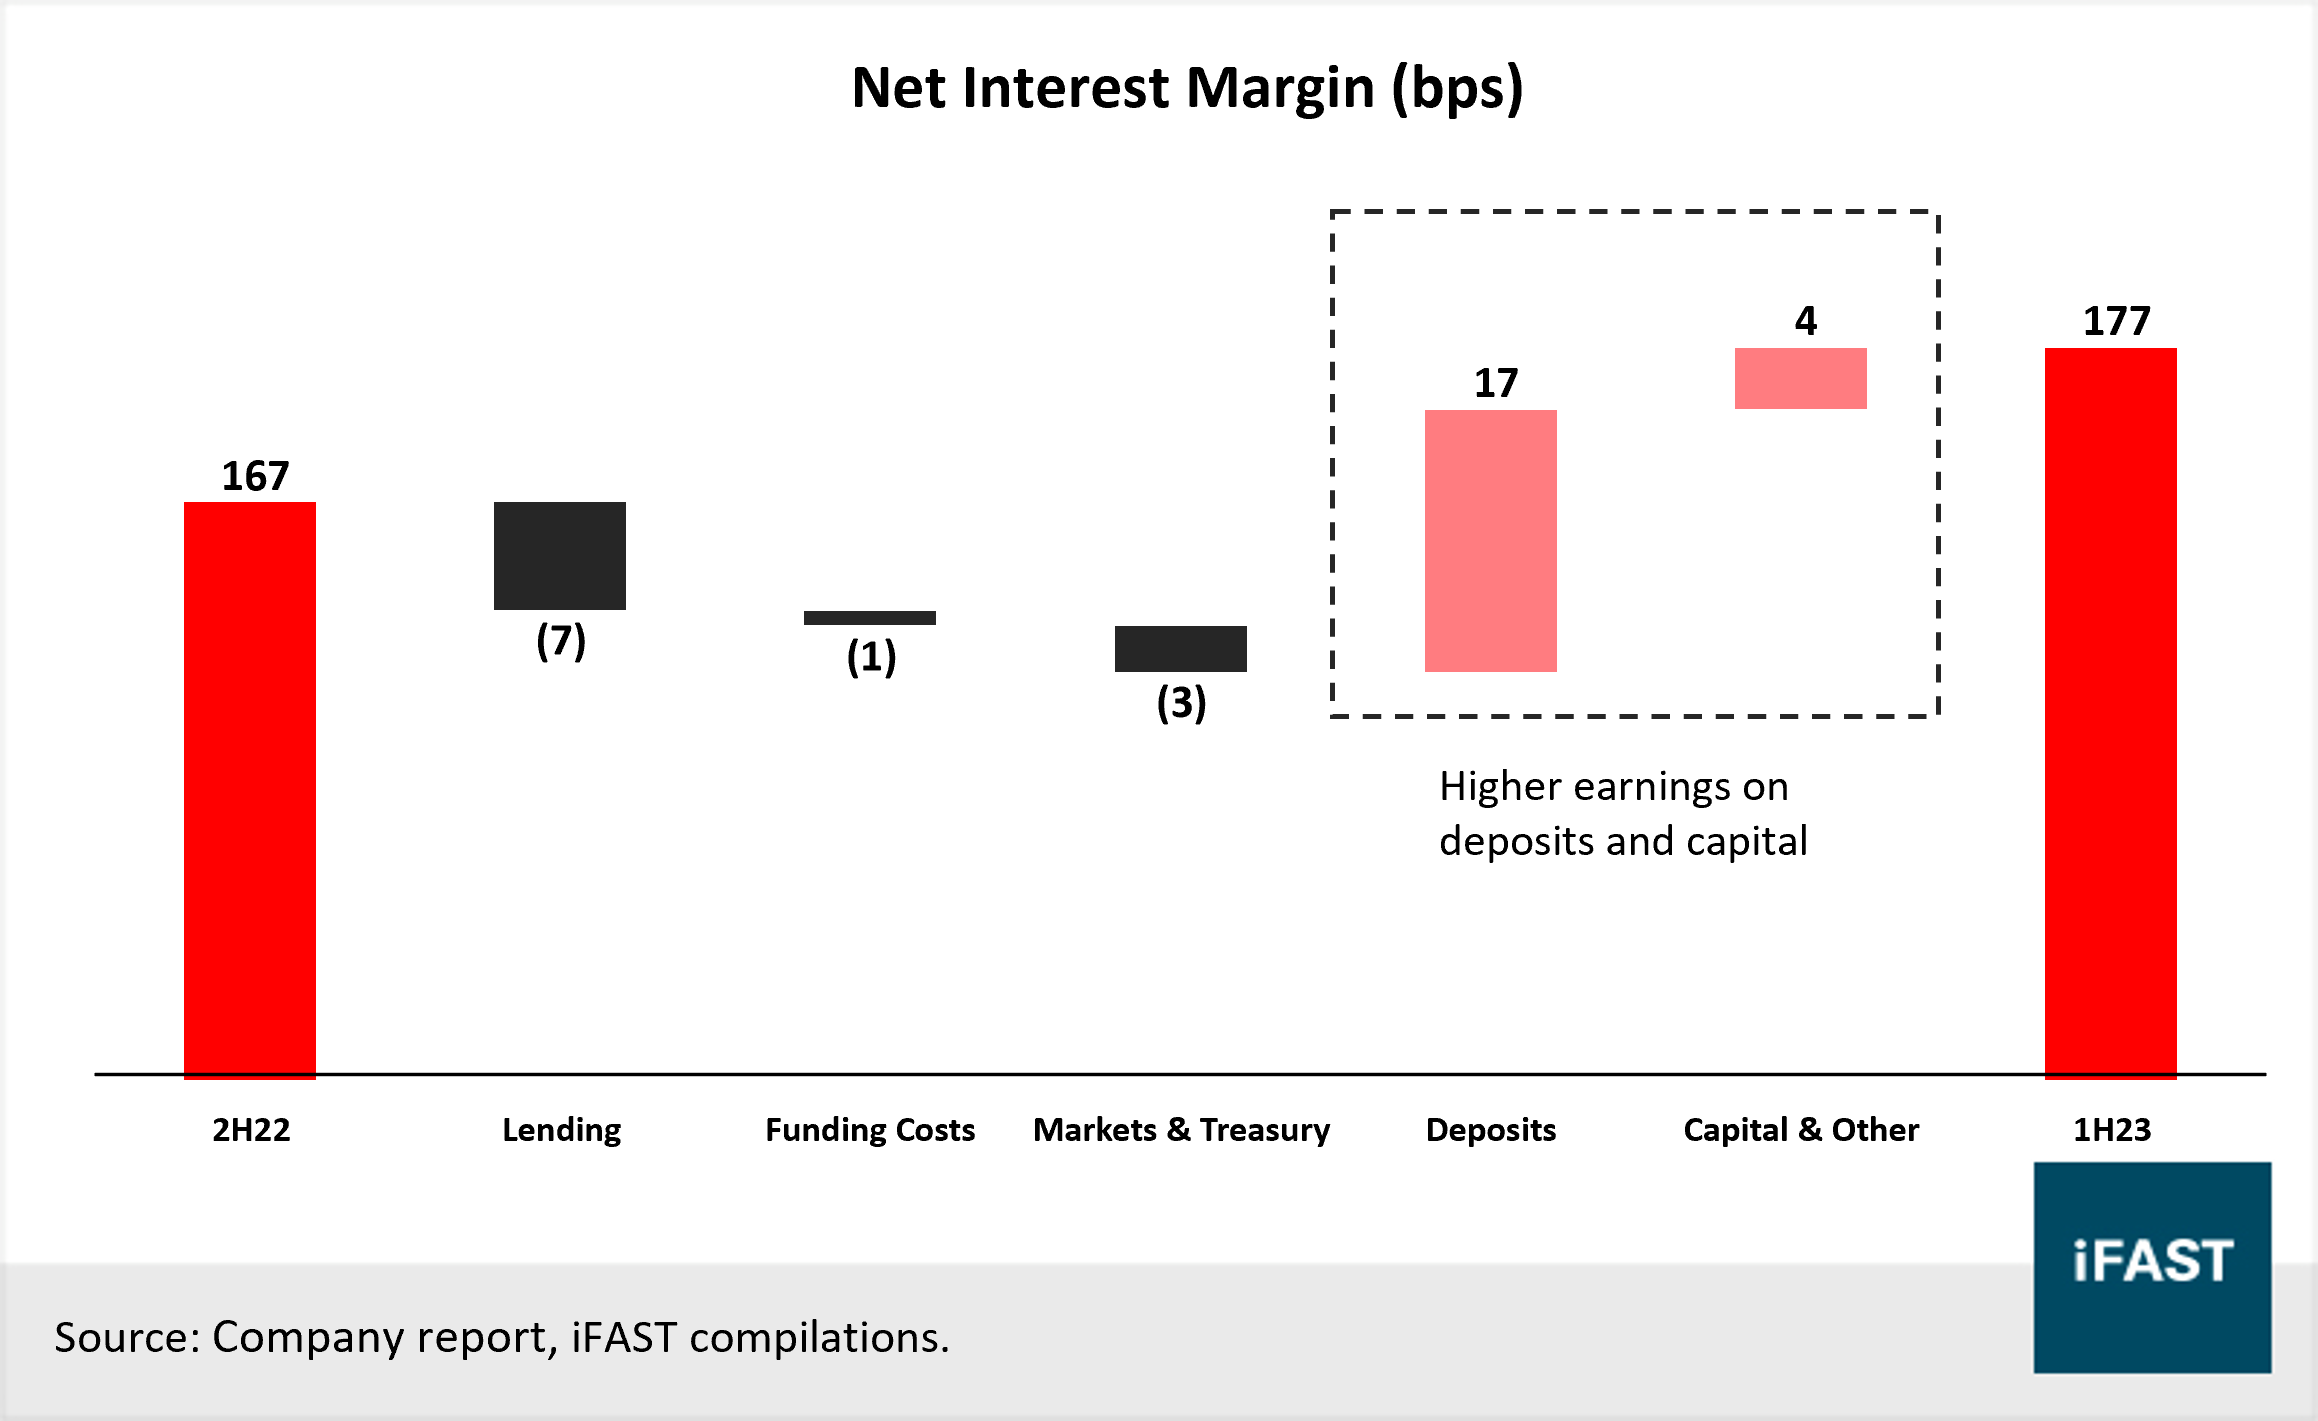
NAB’s NIM improved 10bps from 1.67% (2H22) to 1.77% (1H23), largely due to higher earnings on deposits and capital due to rising policy rates (Chart 2). The bank’s Business and Private Banking segment continues to be a key contributor to margins, with NIM rising 27bps from 3.00% (2H22) to 3.27% (1H23). However, NIM on a quarterly basis dipped slightly from 1.75% (2Q23) to 1.79% (1Q23). NAB’s strong financial performance in 1H23, was also helped by an improvement in other operating income which grew over 20% HoH from AUD $1,701M (2H22) to AUD $2,053M (1H23). While growth in fees and commissions remains firm at low single digits, trading income jumped by 74% HoH.
Chart 1: NAB delivered strong financial performance in 1H23
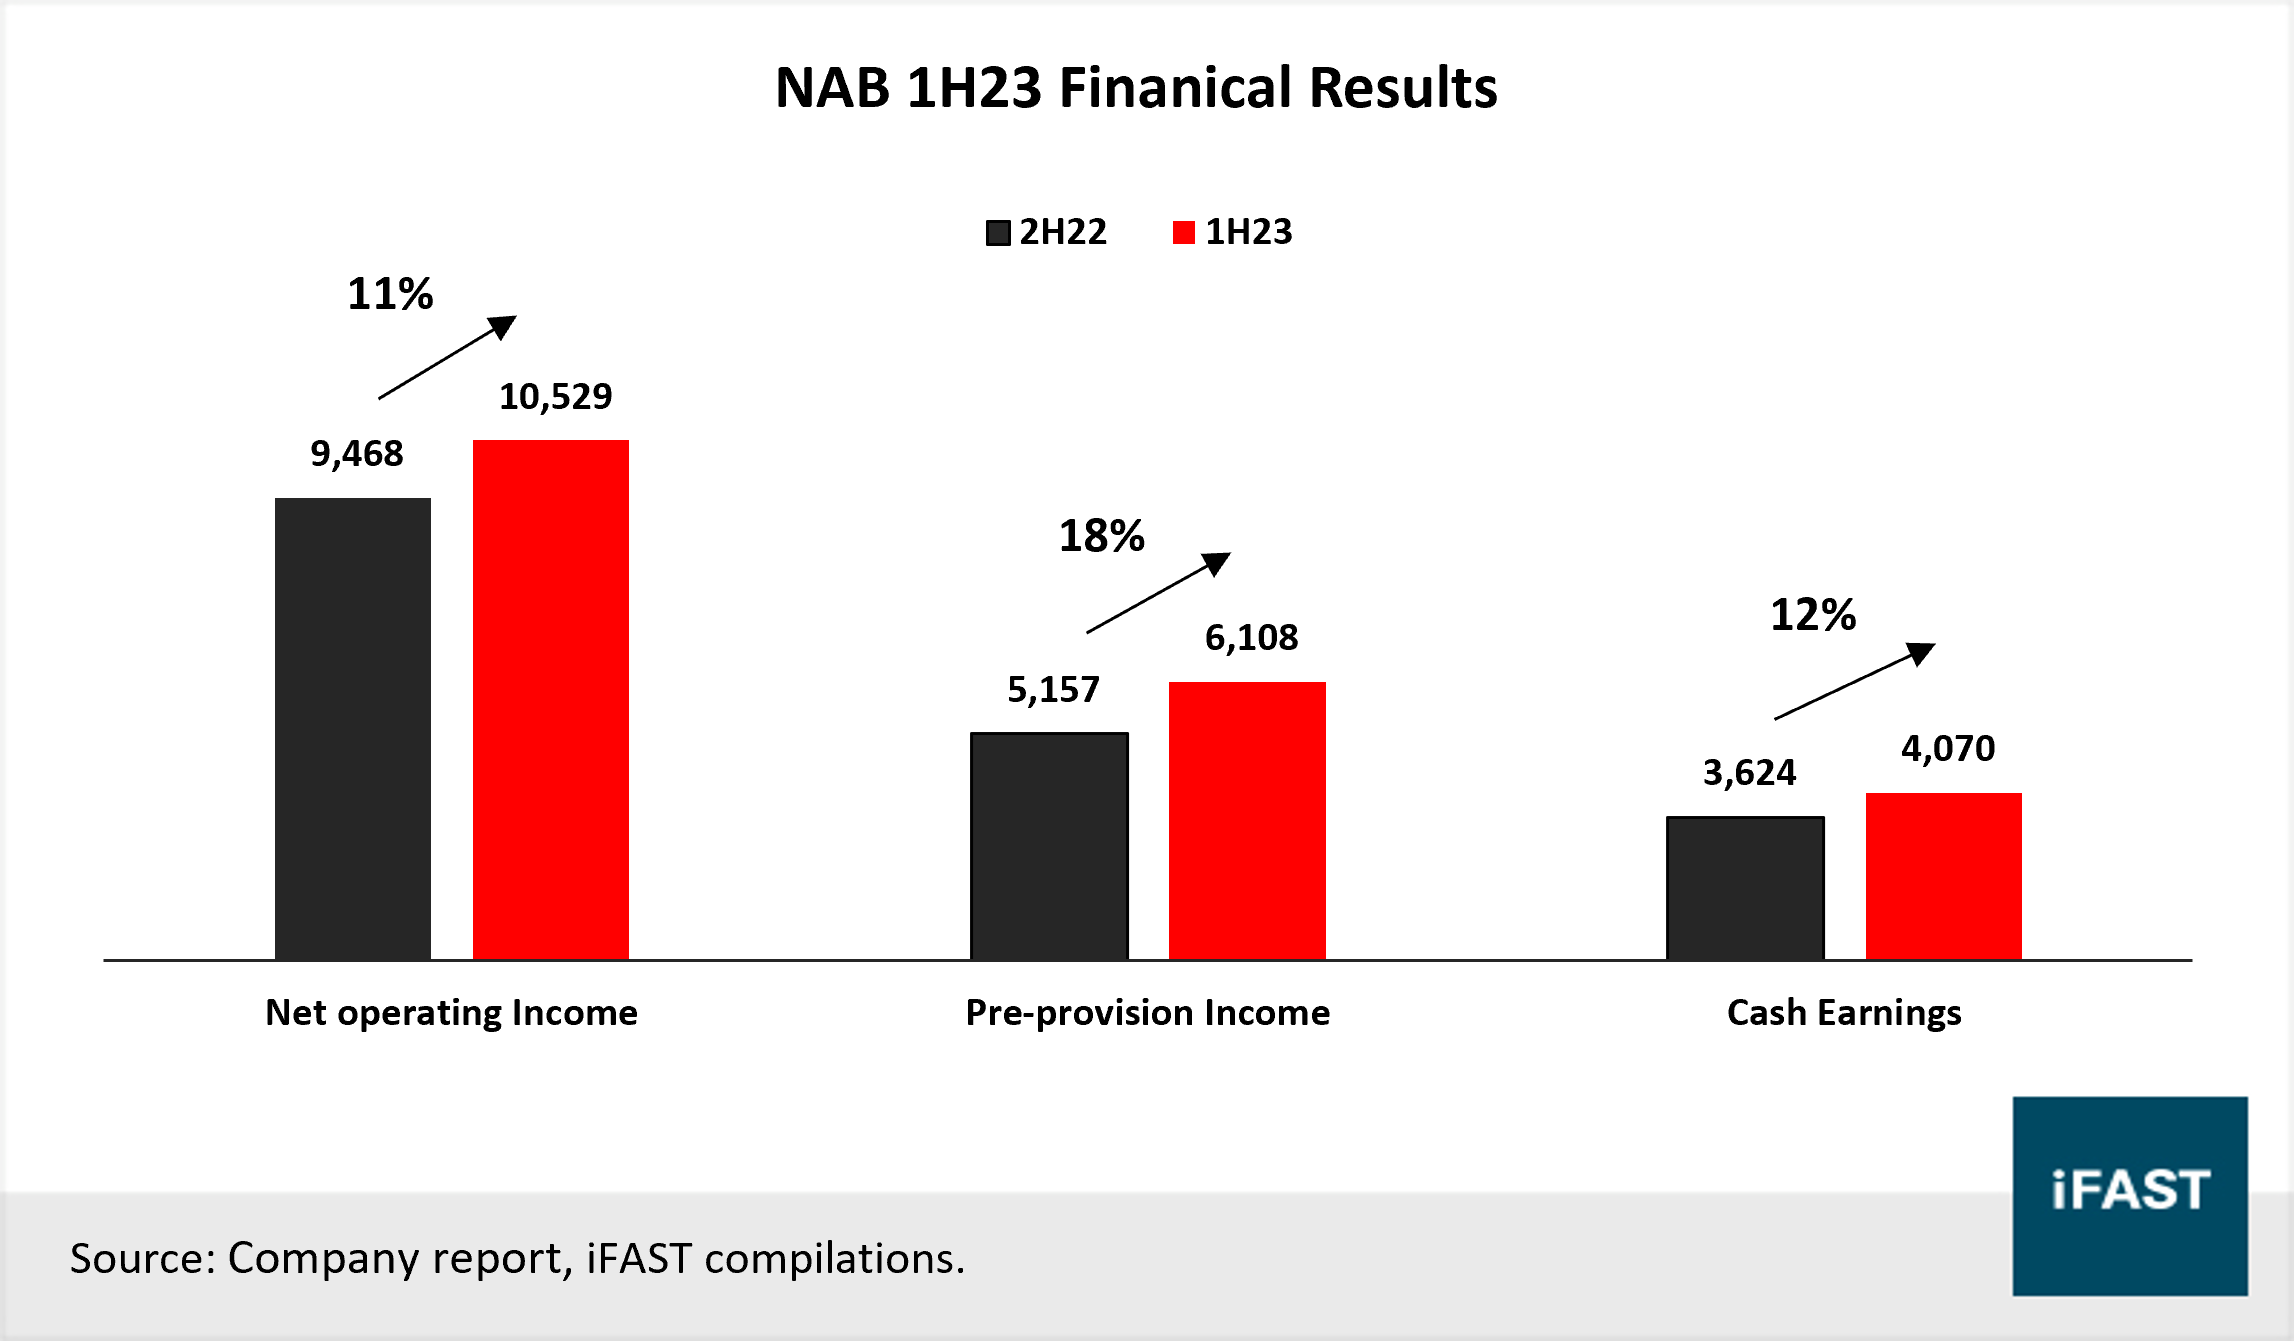
Chart 2: NAB’s NIM improved 10bps to 1.77%
Operating expenses picked up slightly, growing 2.6% HoH from AUD $4,311M to AUD $4,421M as a result of the stronger inflation backdrop. The bulk of higher costs came from greater personnel expenses which includes salary increases, investment in technology capabilities, compliance, and remediation. NAB also recognised higher credit impairment charges of AUD $393M, an increase of AUD $270M from 2H22. As per management’s comments, higher charges reflect the impact of lower house prices, milder volume growth, and an increase in charges designated for the Business and Private Banking segment.
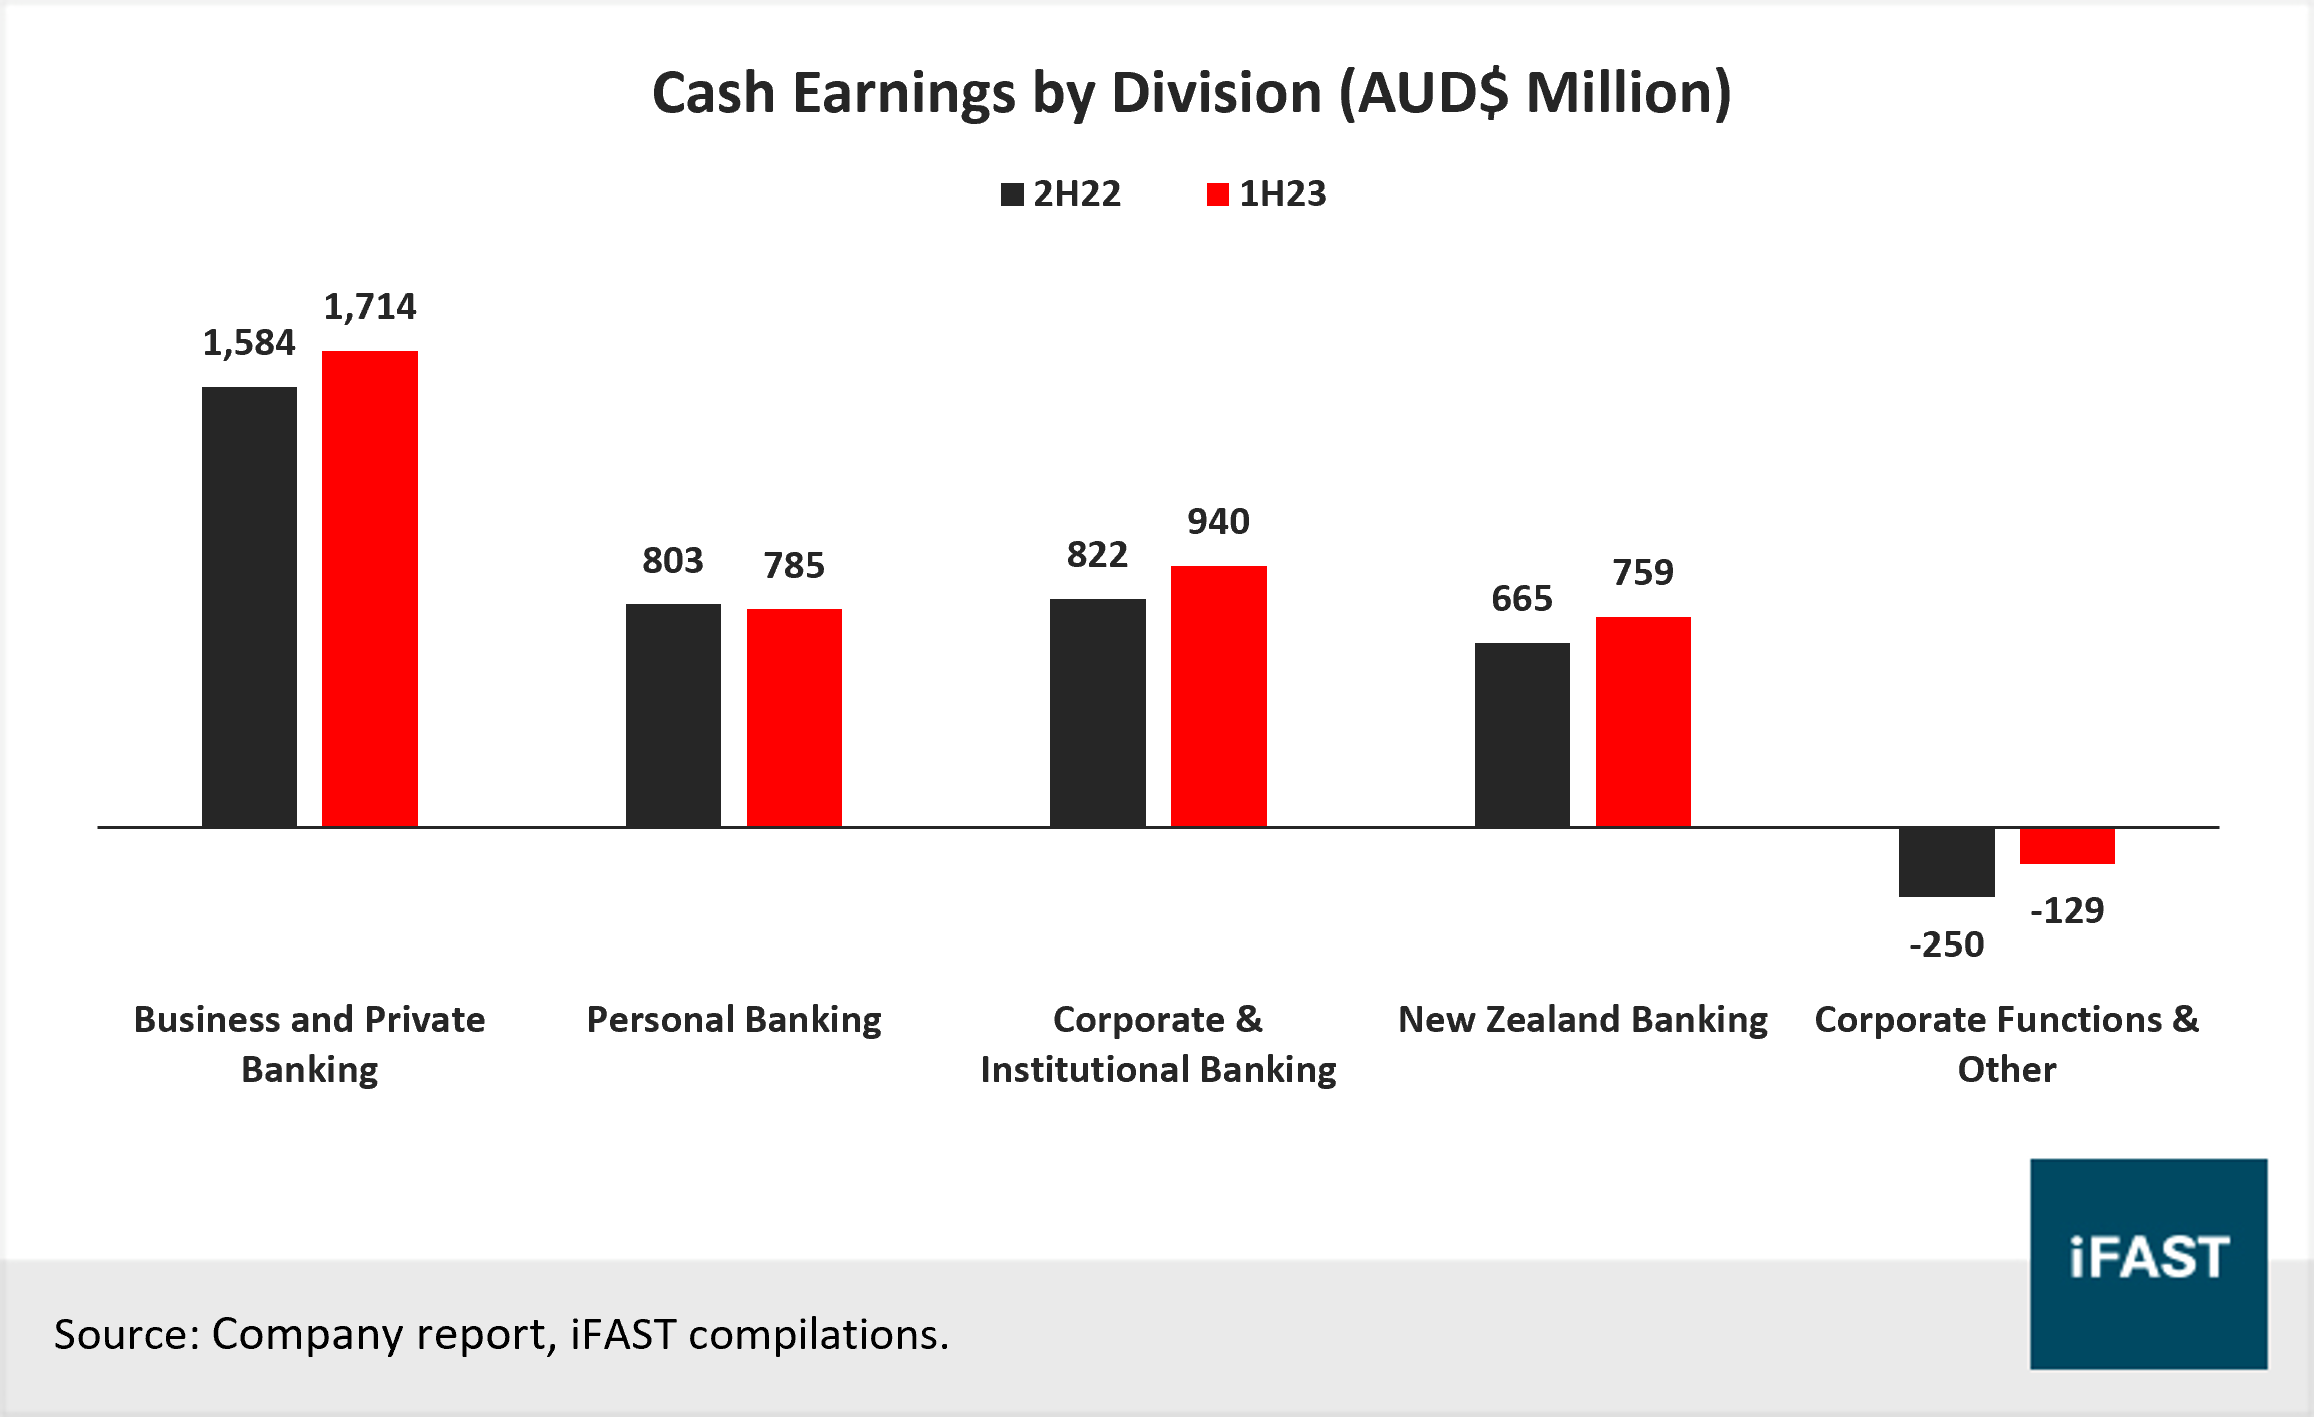
By divisions, the bank registered positive cash earnings growth across most businesses. The Business and Private Banking segment remains the bank’s crown jewel, generating the largest cash earnings. The segment managed to grow cash earnings by 8% HoH to AUD $1,714M, mainly due to healthy business loan growth and a big jump in NIM. Corporate and institutional banking and New Zealand Banking have also delivered good results, with 14% HoH growth in cash earnings.
Chart 3: NAB registered positive earnings growth across most divisions in 1H23
Business Outlook
We expect group NII to remain strong in FY23 with NIM staying high given the cumulative impact of RBA rate hikes and strong NII from Business and Private Banking. However, group NII may face headwinds in FY24 as greater pricing pressure across home loans caps NIM growth while home loan volumes are likely to moderate. Beyond FY24, we expect NII to recover.
Like the past few years, we expect operating income to see firm growth from resilient trading income, the segment’s second largest contributor. Operating expenses should continue to grow as staff-related expenses stay elevated. However, we expect slower growth with management guiding for lower cost-to-income ratio in FY23 and savings from productivity benefits.
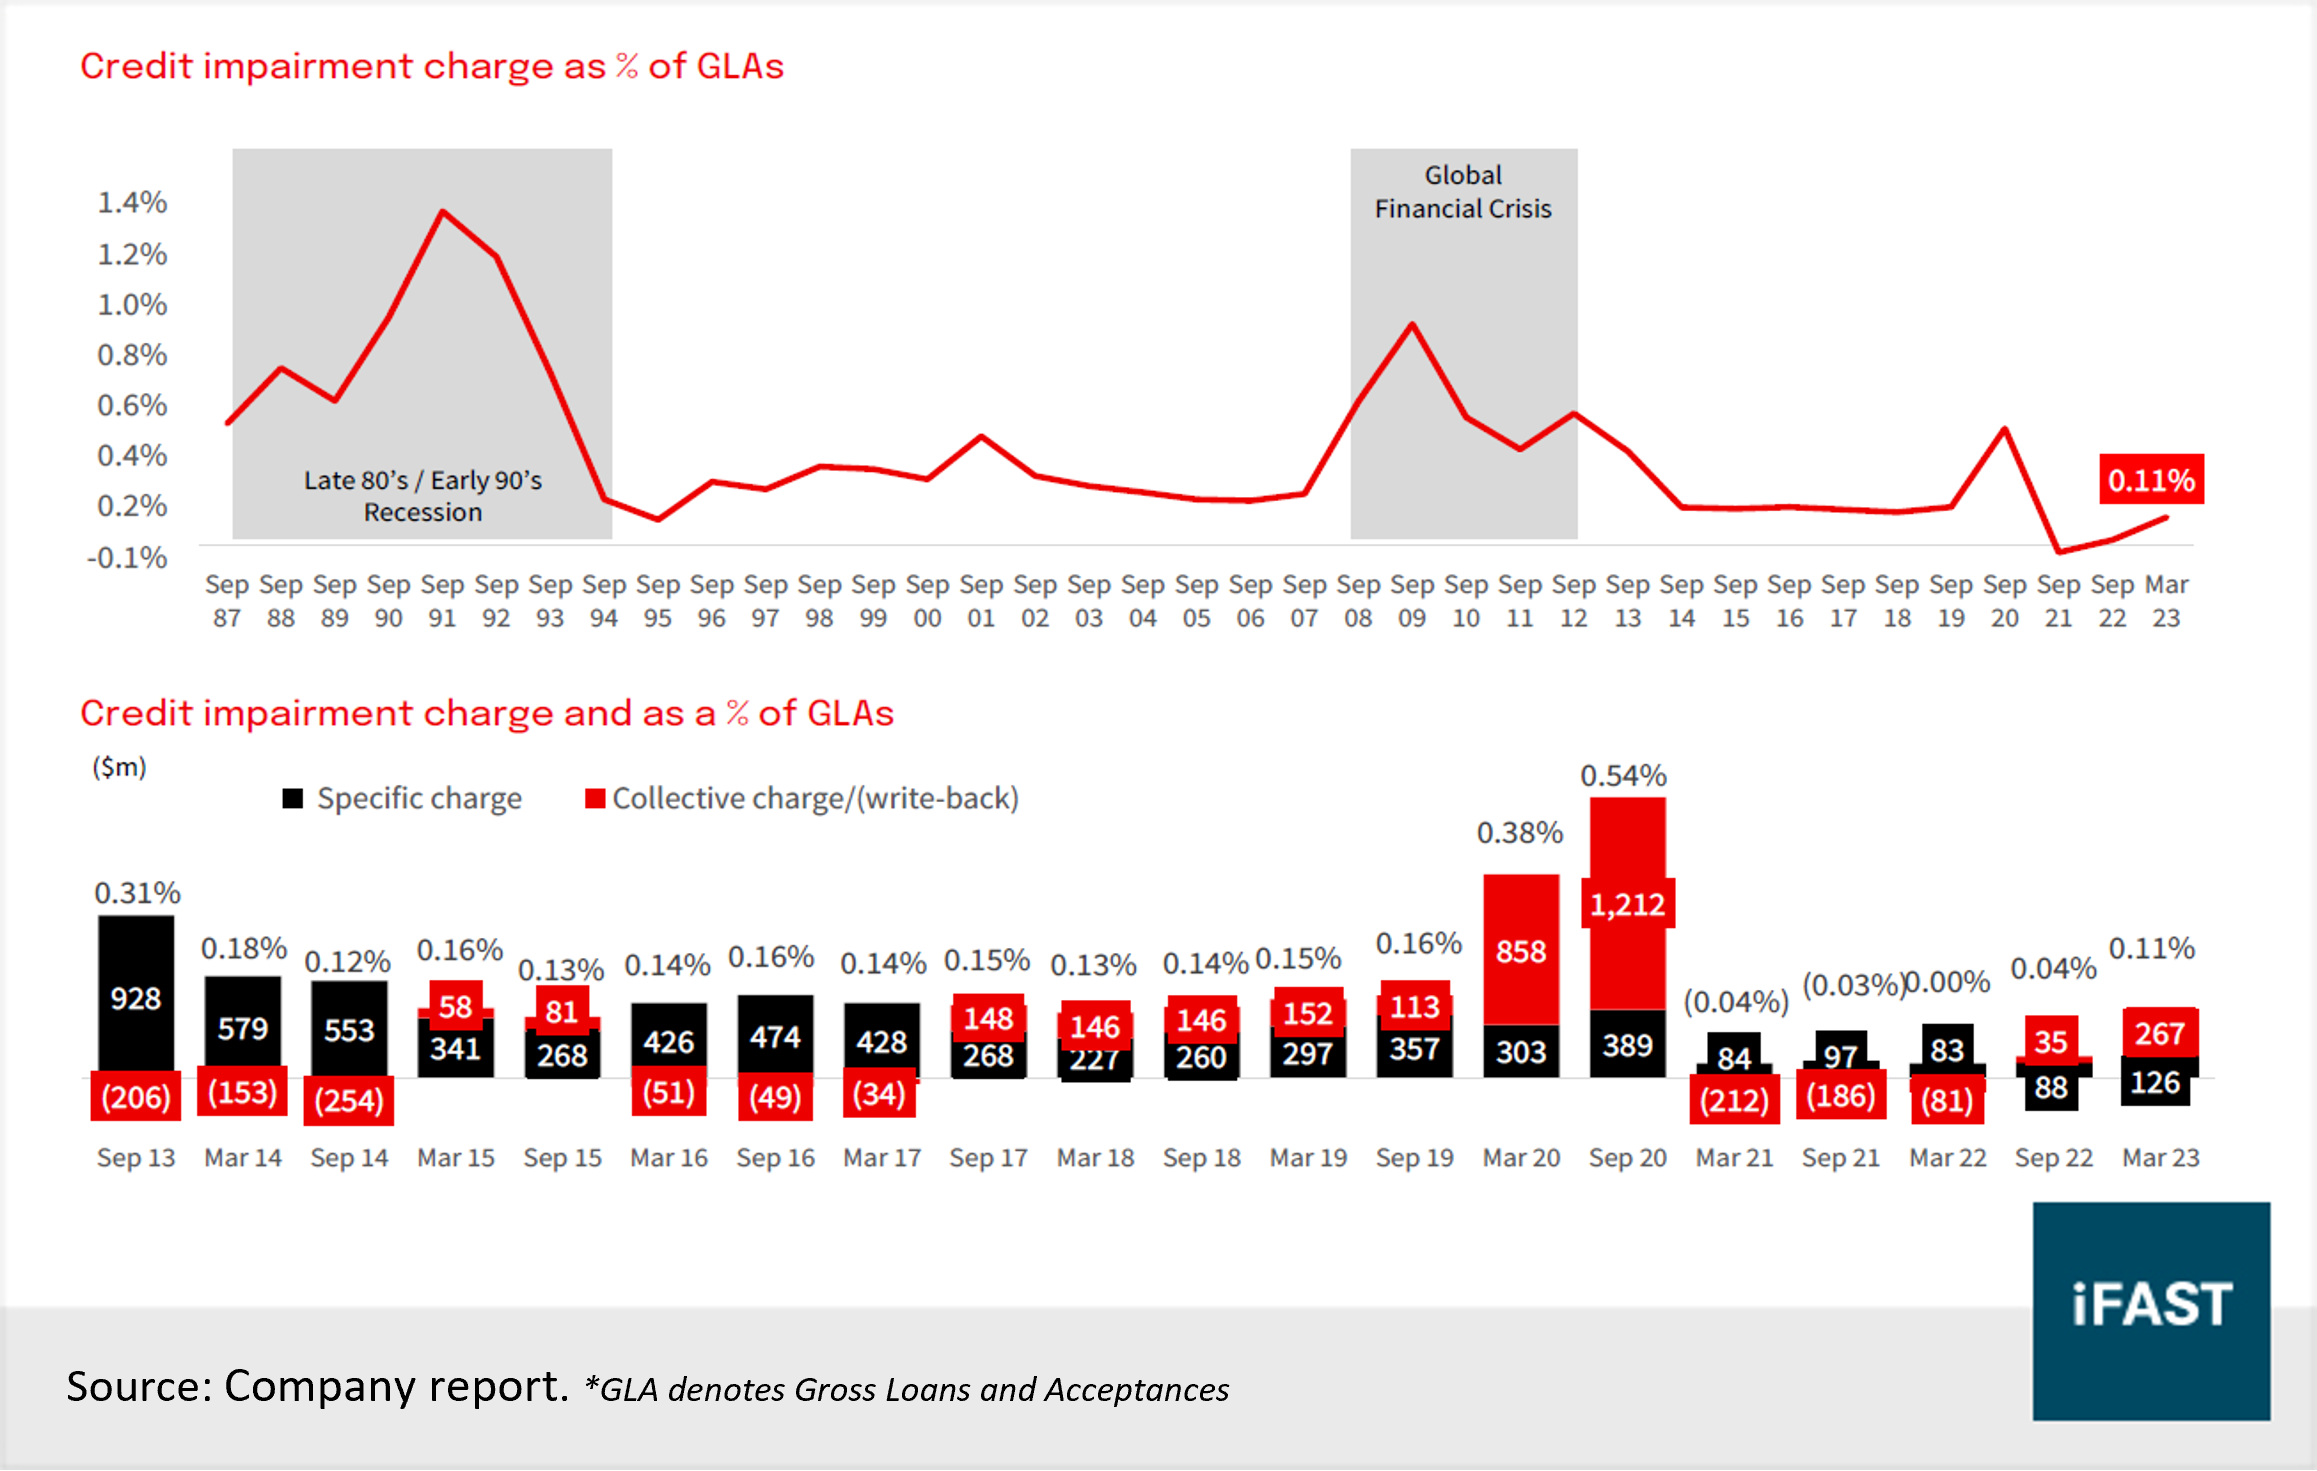
Currently, NAB’s impairment expenses remain low but we expect it to float towards pre-covid levels (20 – 30bps higher, as a percentage of gross loans and acceptance) given tight financial conditions and a deterioration in the housing loan book (Chart 4). Impairment expenses may move higher if economic growth in Australia moderates. As seen across the industry, impairment expenses will likely be the main drags on NAB’s earnings in FY23 and FY24.
Overall, we expect net profit after tax to see stronger growth in FY23 before softening in FY24 on NII headwinds. We expect a recovery over the subsequent few years as Australia’s economic condition improves and pressure on the housing market eases.
Chart 4: Credit impairment expense remains low against history but is likely to pick up from here
Credit highlights
1. Asset Quality
For NAB’s Australian home lending, the asset quality has weakened slightly, due to the rate hike, but risks remain well-managed. The bank’s Australia lending book increased by 1.2% HoH from AUD $329B (2H22) to AUD $333B (1H23). That said, the loan-to-value ratio (“LTV”) for new loans has declined to 63% (1H23), the lowest in the past 12 months. This shows that borrowers have taken less loan, on average, relative to the property’s value. Generally, a lower LTV represents less risk to the bank.
Looking at a more robust measurement for LTV which accounts for the changes in property value, the dynamic LTV (“DLTV”), saw a slight bump from 41% (2H22) to 43% (1H23). We are not overly concerned as the DLTV remains low across history. At the same time, the share of negative equity within NAB’s Australia housing portfolio (property’s mortgage exceeds its market value) remained muted at 1.1%.
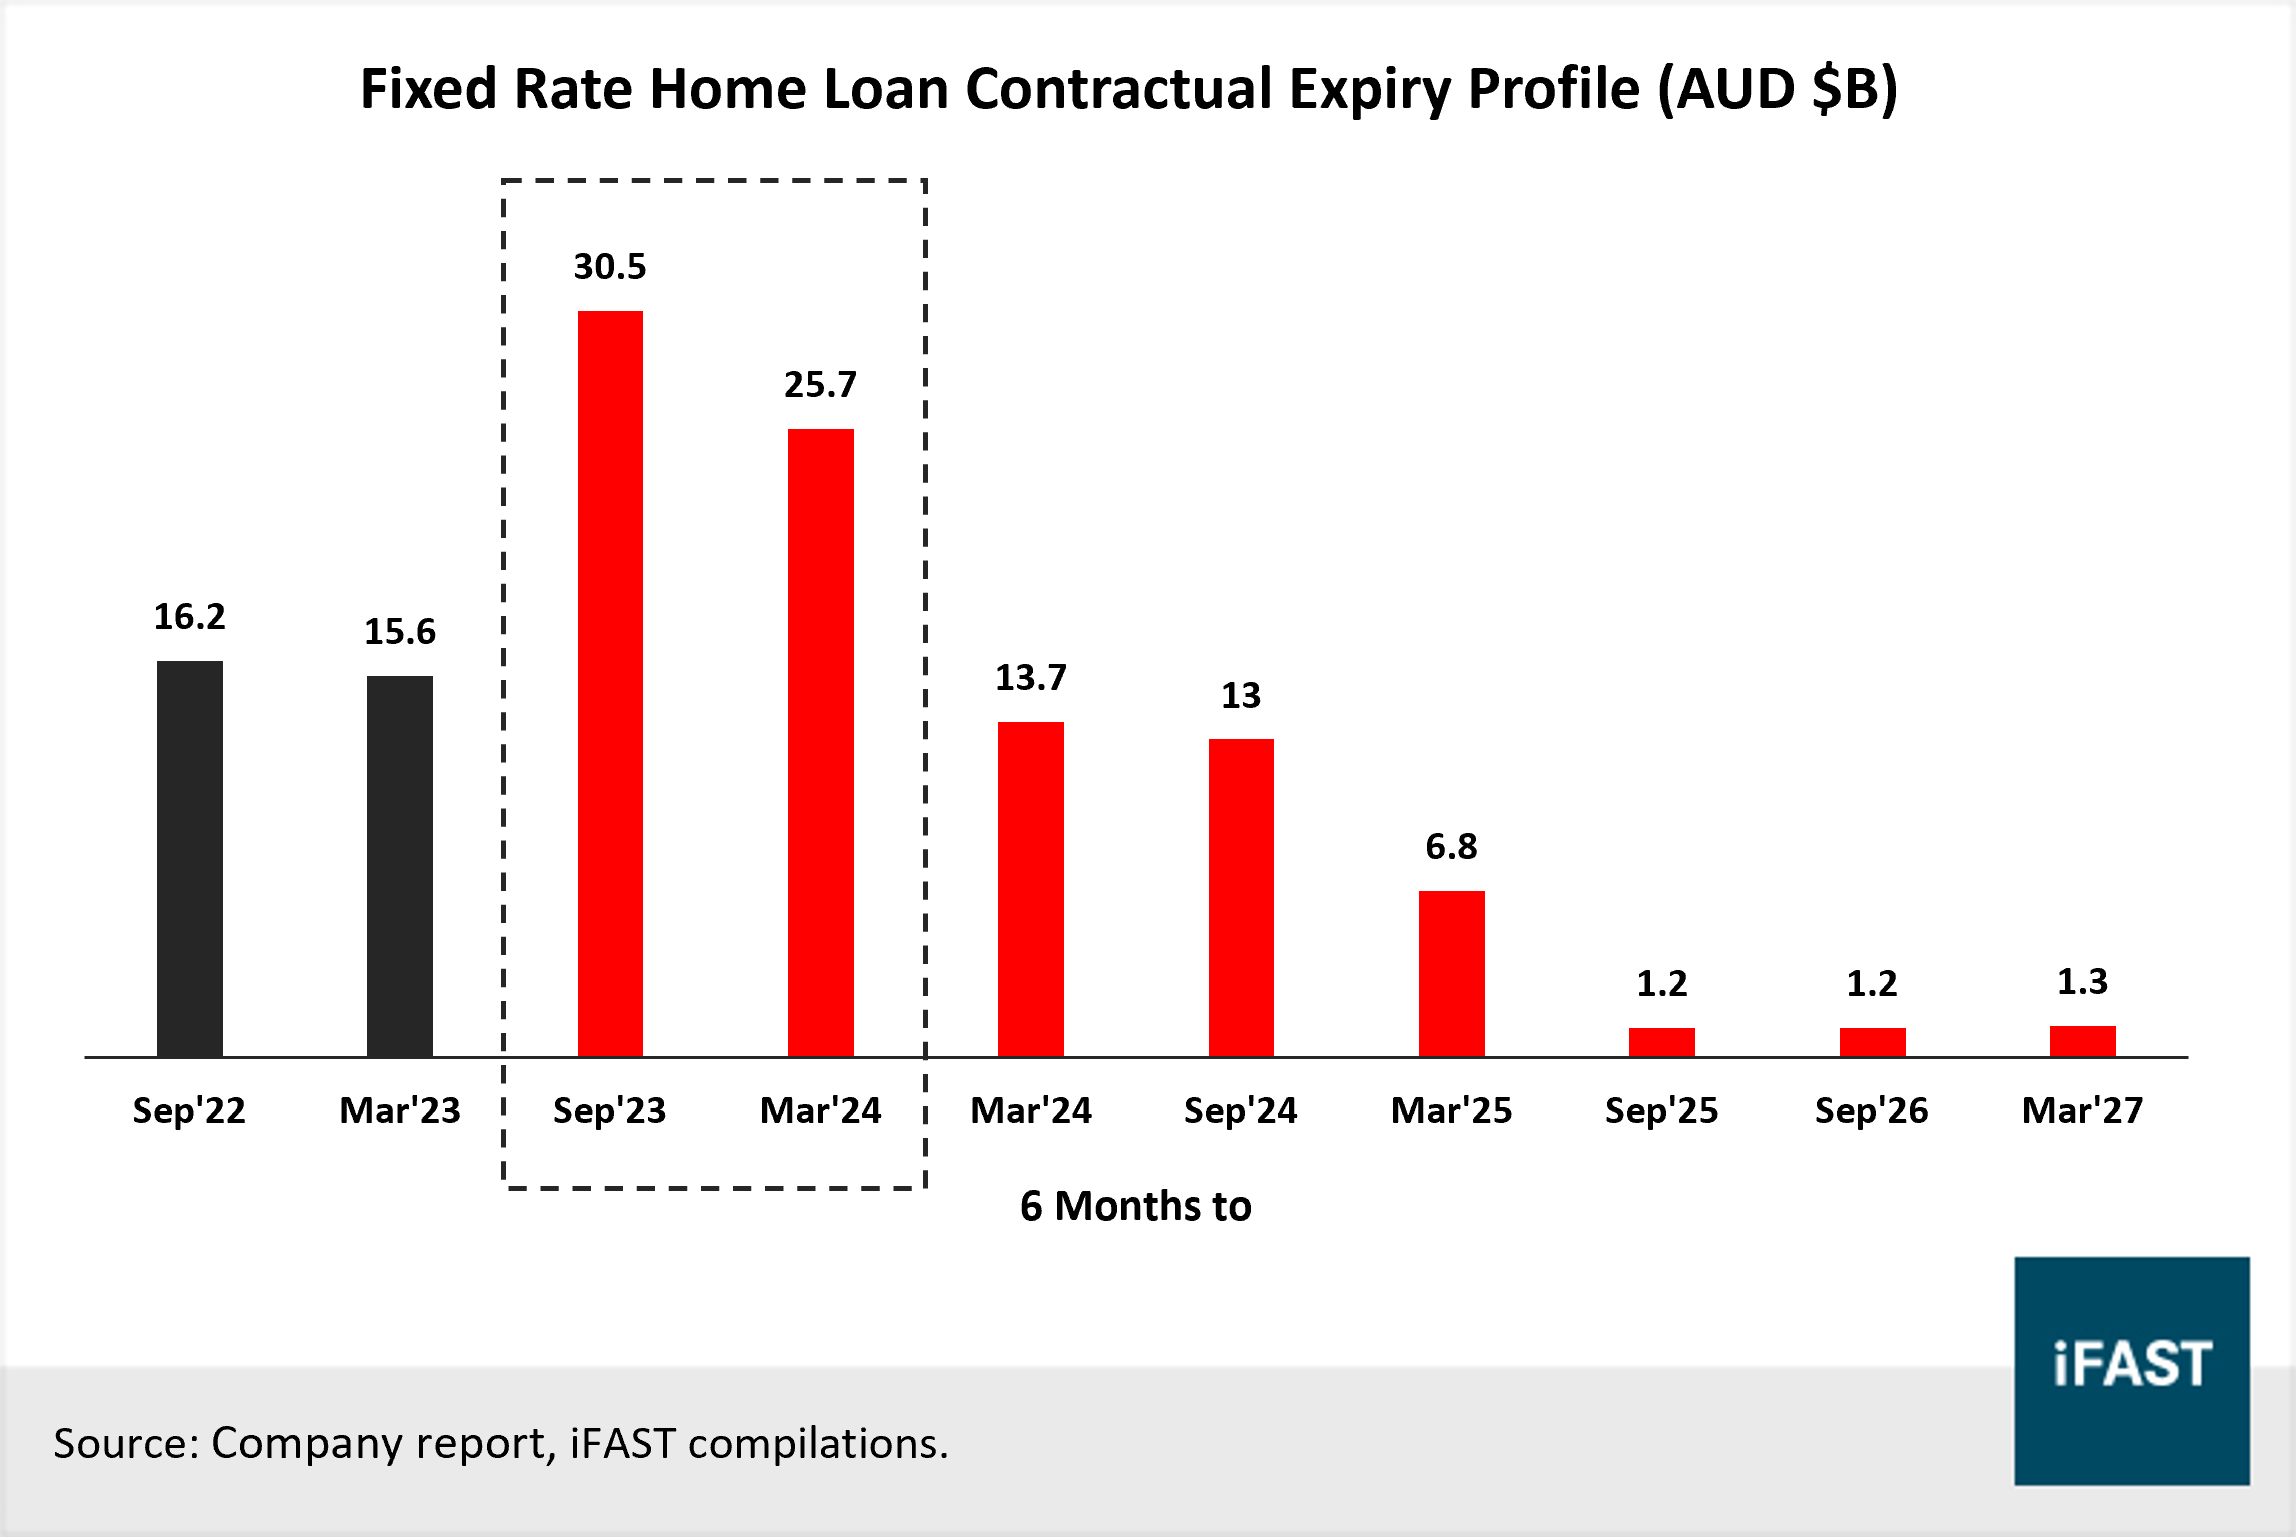
That said, the portfolio could see some deterioration in asset quality given greater expiries from fixed-rate loans in 2H23 and 1H24 (Chart 5). AUD $31 billion fixed rate loans are expected to expire in 2H23 and AUD $26 billion in 1H24. However, we see signs that the risk remains controlled at the moment. First, housing loans that are due past 90 days (as a percentage of gross loans and acceptance “GLAs”) have also fallen from 0.73% to 0.67%. Second, looking at early-stage arrears, using a more stringent 30 days measurement, the ratio remains at a lowly 1.2%, below the 10-year average.
Chart 5: Greater expiries from fixed rate loans coming in 2H23 and 1H24
For business lending, we find the asset quality to be largely unchanged. Around 50% of the bank’s business lending book are investment grade quality in 1H23. This proportion has remained unchanged over the past few years. In addition, around 63% of business loans are fully secured, with an additional 19% being partially secured. Similarly, this proportion has hardly changed over the past few years. Business loans that are due past 90 days maintained at 0.56% (1H23), up marginally from 0.54% (2H22). However, the percentage seen over the past few years have barely fluctuated, reflecting the high quality nature of NAB’s business lending portfolio.
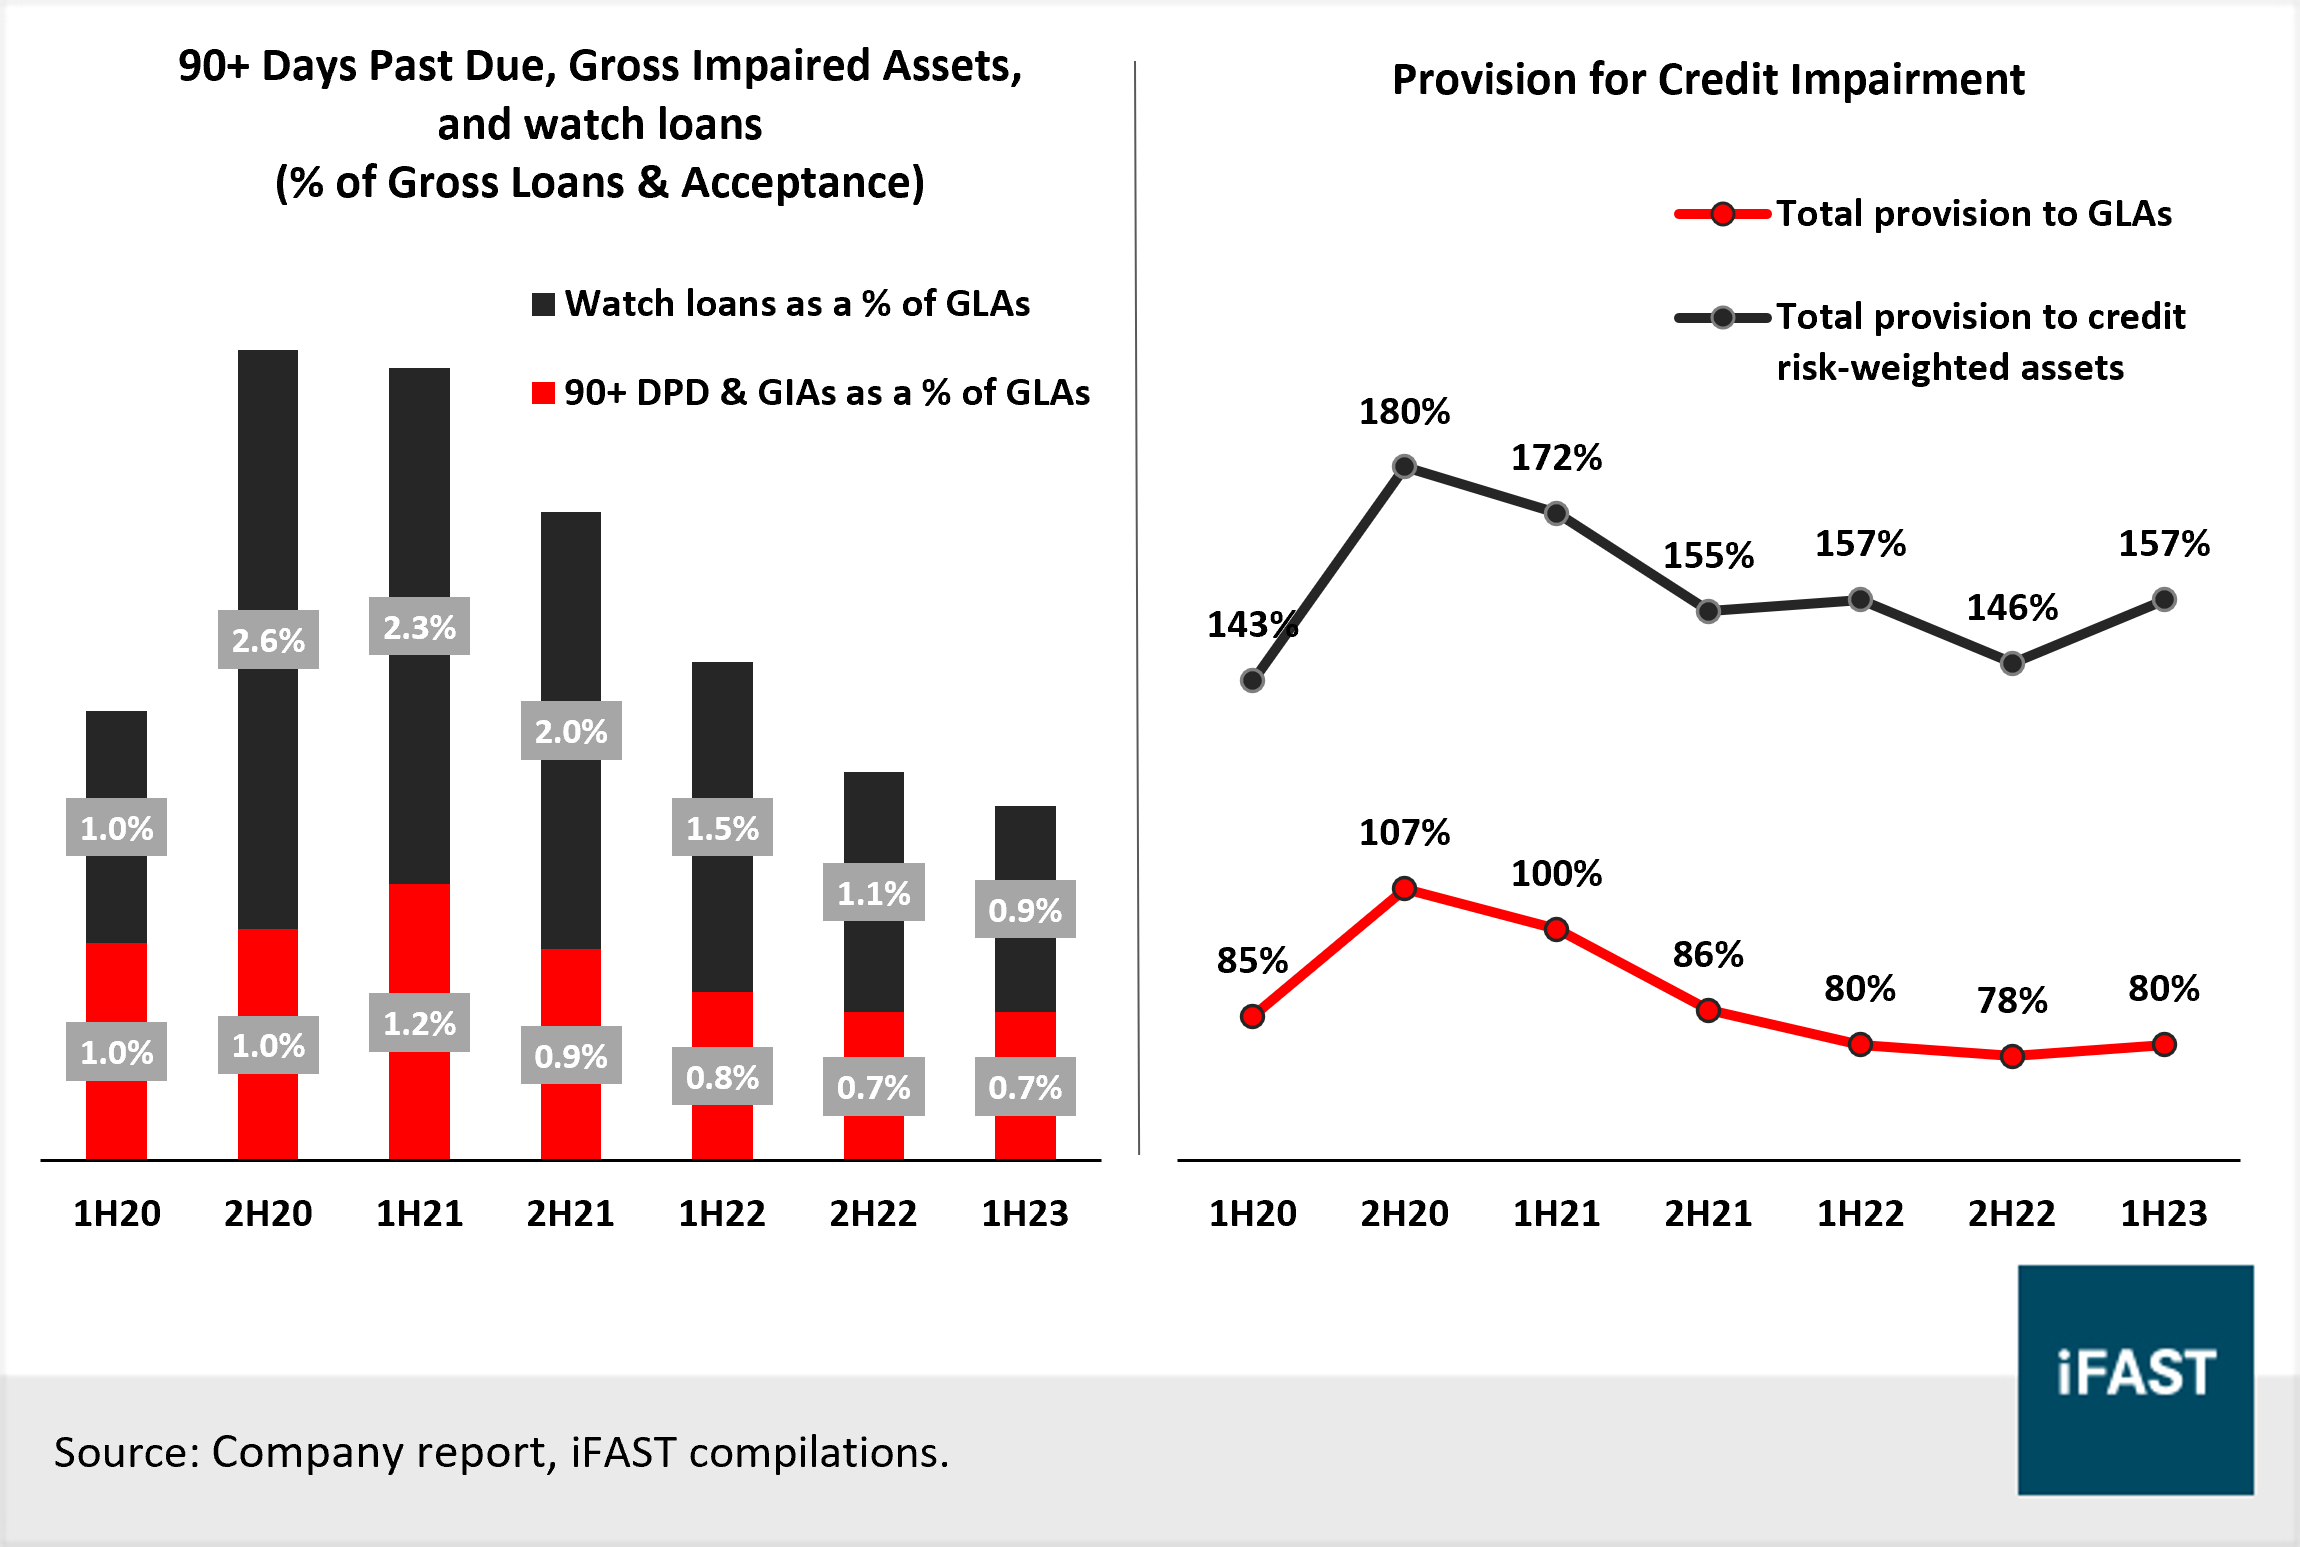
As a whole, NAB’s asset quality remains resilient and well-provisioned. First, total loans due past 90 days and gross impaired assets remain low at 0.66% of GLAs in 1H23. Second, watch loans as a percentage of GLAs have also fallen from 1.07% (2H22) to 0.92% (1H23) (Chart 6). Overall, non-performing exposures (exposures that are in default) as a share of GLAs stayed less than 1% (0.96%) in 1H23.
NAB has also increased provisions by AUD $220M from AUD $5,357M (2H22) to AUD $5,577M (1H23), which is already above management’s central economic scenario. We think total provisions remain sufficiently strong, covering 80% of GLAs, and 157% of credit risk-weighted assets (Chart 6).
Chart 6: Arrears, gross impaired assets, and watch loans have declined while provision has started to increase
2. Capital Position and Liquidity
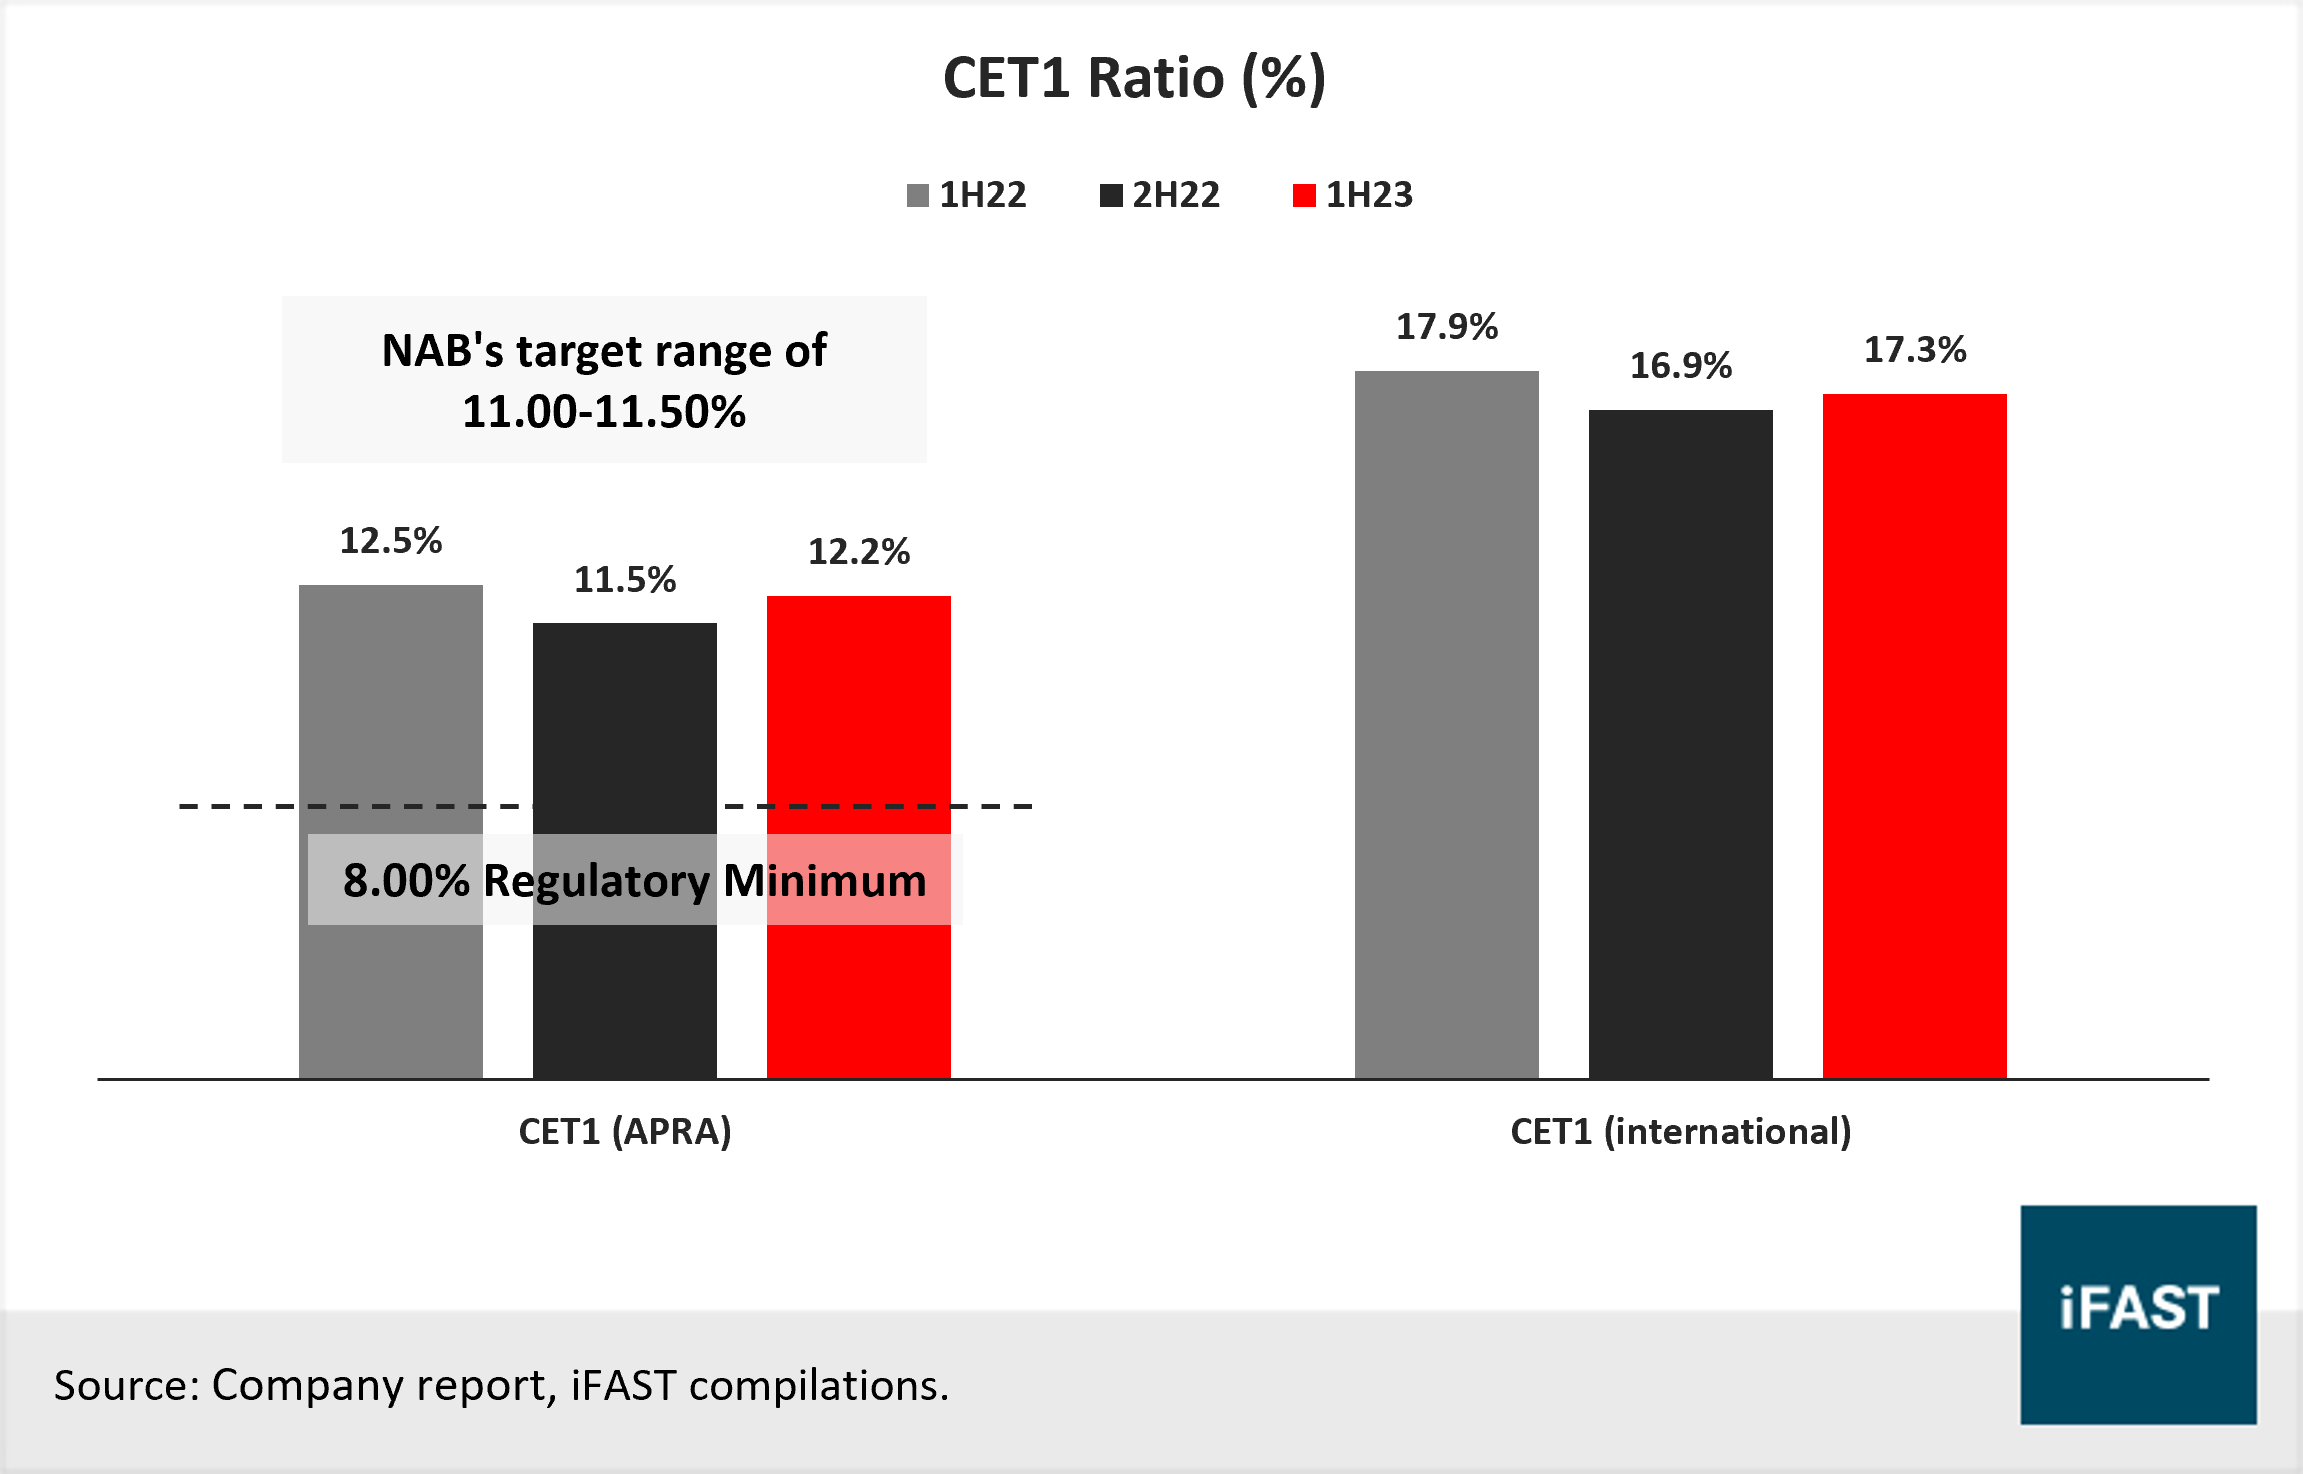
Capital position for NAB remains strong and is one of the bank’s strongest points in our opinion. The bank’s total capital grew by AUD $4,433M from AUD $81,735M (2H22) to AUD $86,168 (1H23), driven mostly by larger tier 2 capital. APRA Basel III CET1 ratio improved by 70bps, growing from 11.51% (2H22) to 12.21% (1H23), given strong organic contributions from cash earnings (+90bps) which more than offset the drag from dividend distribution (-55bps).
CET1 ratio continues to exceed the regulatory prudential minimum of 8.00% and the bank’s internal target range of 11.00-11.50% (Chart 7). Management has also expressed the desire to remain prudent towards buybacks considering market conditions. This should keep CET1 capital supported with the guided dividend payout ratio (65% – 75% of cash earnings). On an internationalised basis, NAB’s CET1 ratio stands at 17.3% (1H23), up from 16.9% (2H22), which is comparably high amongst global peers.
Chart 7: CET1 ratio remains above target and regulatory minimum
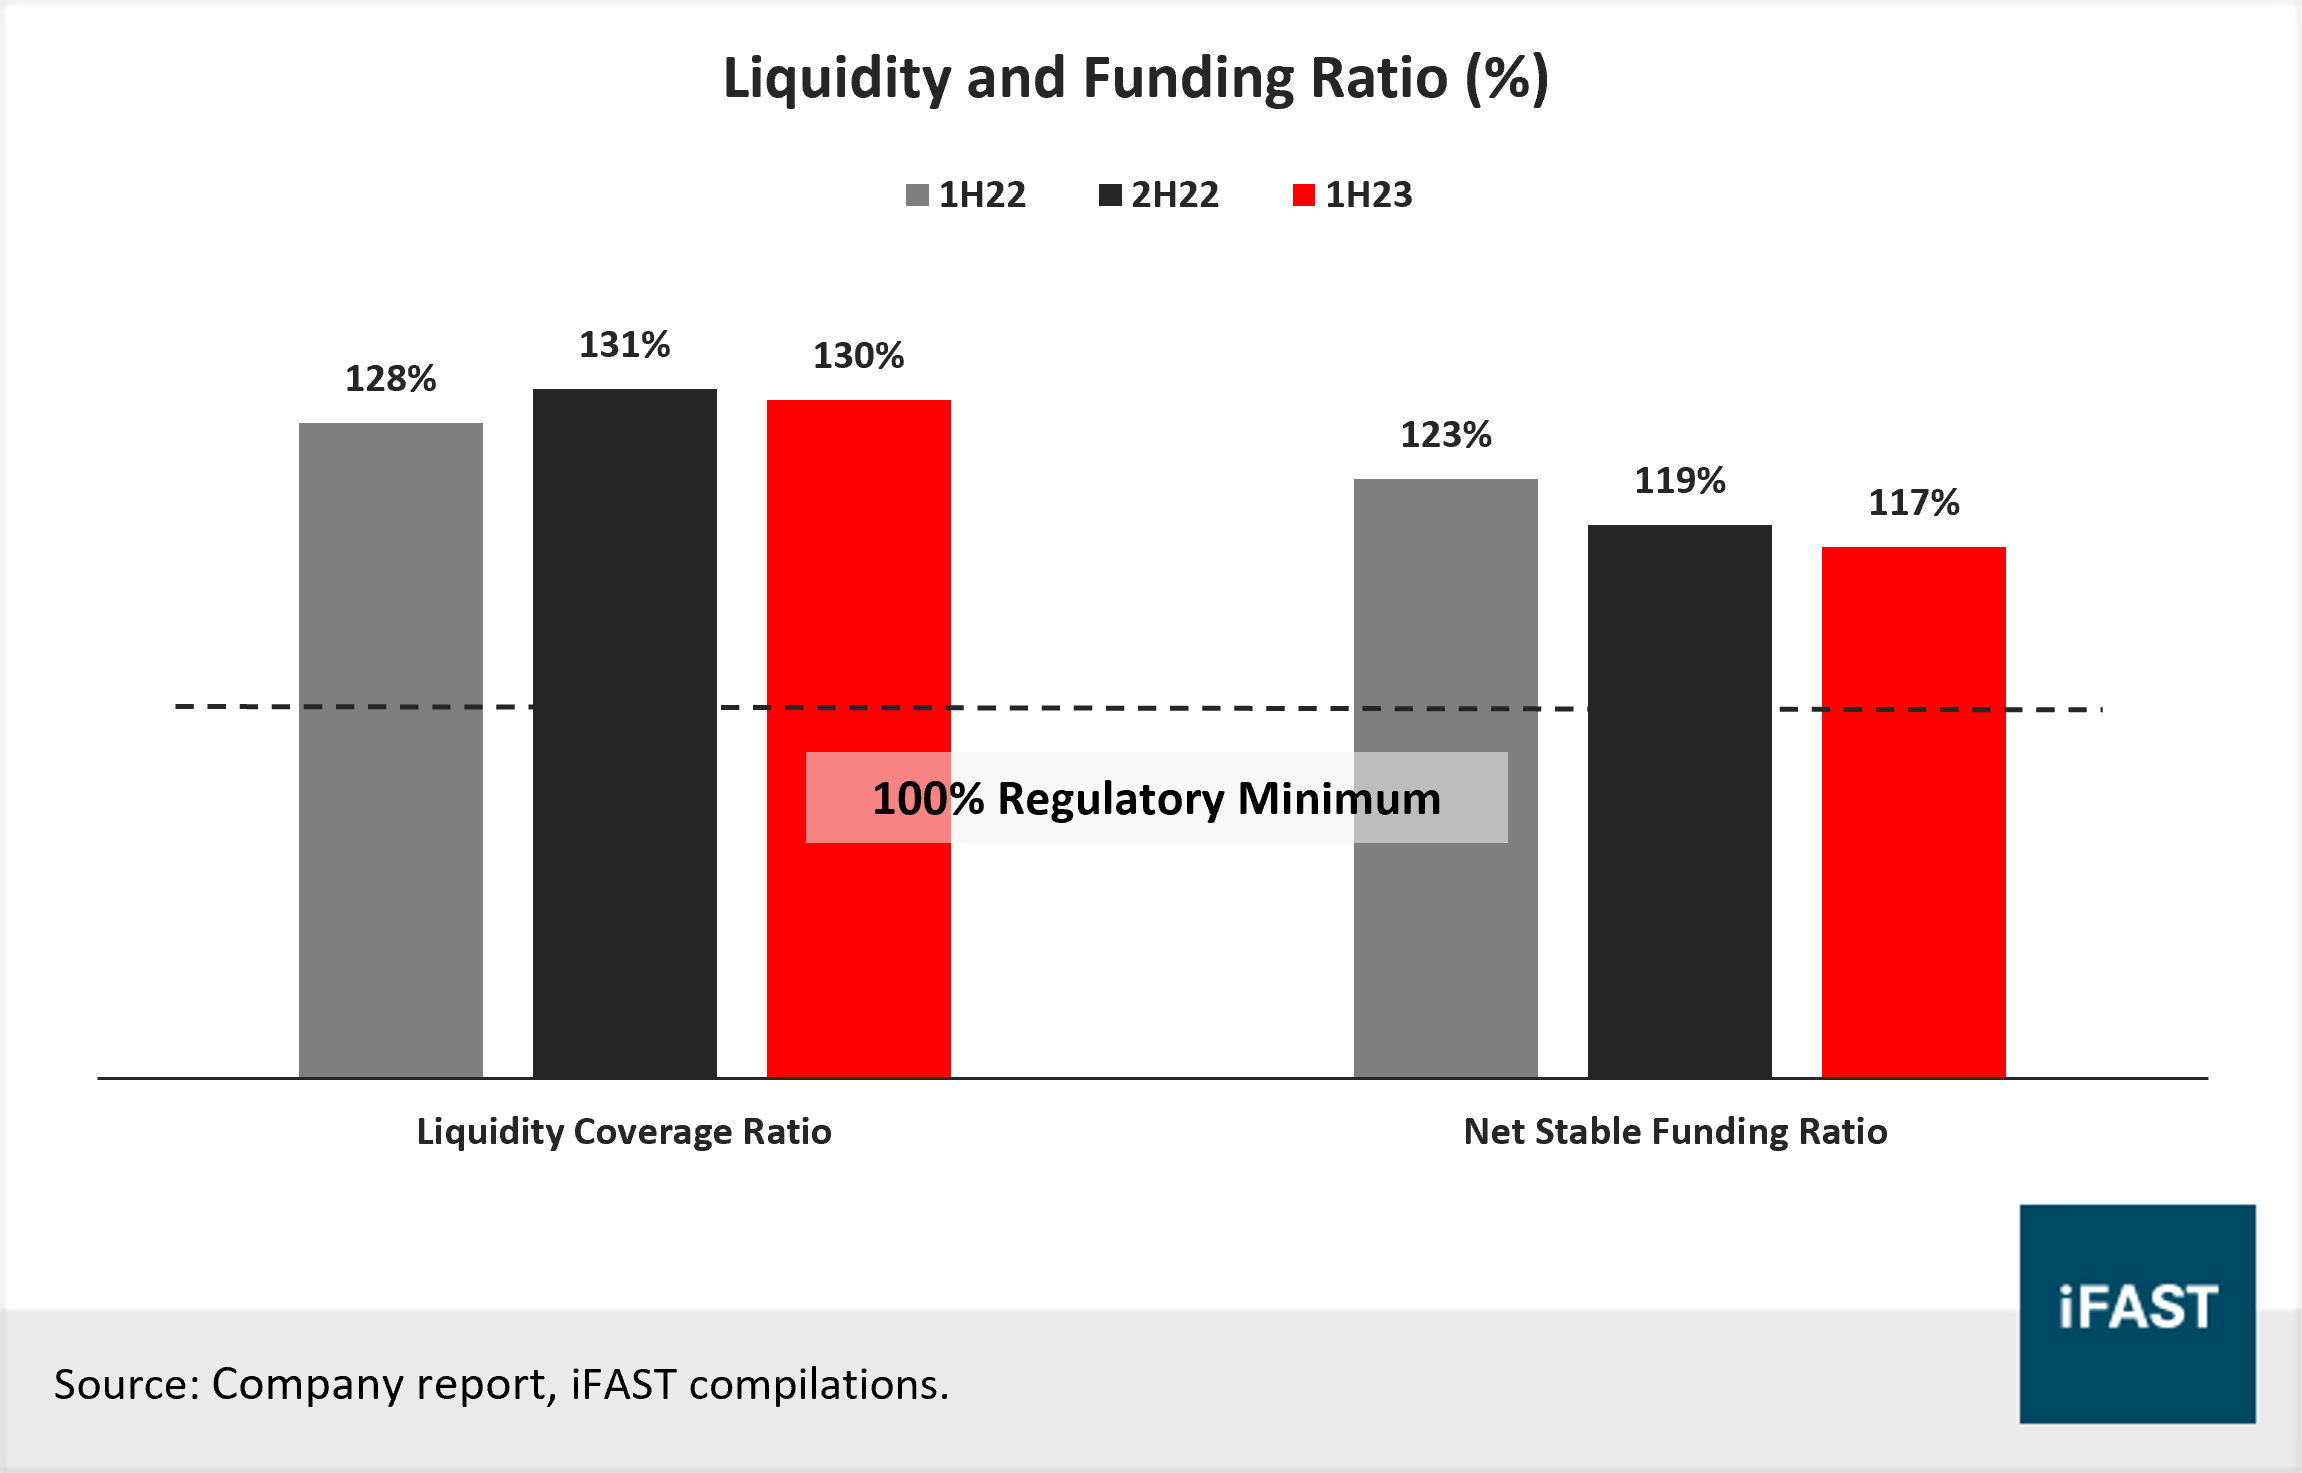
NAB also has a strong liquidity position. Over 80% of GLAs are funded by customer deposits, which are a more stable source of funding. The quarterly average value of liquid assets fell from AUD $214B (end Sep ’22) to AUD $202B (end Mar’23), due to a fall in the value of alternative liquid assets while the widely watched, high-quality liquid assets (“HQLA”) maintained at AUD $200B (end Mar’23). Overall, the quarterly average liquidity coverage ratio (“LCR”) was able to maintain at a strong 130% (end Mar ‘23). Meanwhile, the net stable funding ratio (“NSFR”) was 117% (end Mar ’23), with management guiding for moderate moderation to pre-covid levels moving ahead. Nonetheless, both ratios showed large buffers to the 100% minimum regulatory requirements (Chart 8).
Chart 8: Liquidity and funding ratios remain healthy, above the regulatory minimum
Recommendations
Table 1: Tier 2 Subordinated Issues
|
Issue |
Ask Price |
Yield to Call/ Yield to Maturity (%) |
Years to Call/ Years to Maturity |
Bond Credit Rating (S&P/Fitch) |
OAS Spread |
|
96.99 |
5.98/ 6.13 |
3.46/ 8.47 |
BBB+/ A- |
216 |
|
|
102.13 |
5.72/ 6.01 |
4.00/ 9.00 |
BBB+/ A- |
195 |
|
|
100.88 |
5.94/ 6.04 |
4.60/ 9.60 |
BBB+/ A- |
201 |
|
|
91.95 |
6.45/ 6.53 |
4.10/ 9.10 |
BBB+/ A- |
243 |
|
|
100.29 |
5.99/ 6.03 |
3.84/ 8.85 |
BBB/BBB+ |
235 |
|
|
Sources: Bloomberg Finance L.P., Bondsupermart, iFAST Compilations. Data as of 3 August 2023. |
|||||
Overall, the credit profile for NAB remains solid given a positive earnings outlook, strong capital, and liquidity position while being sufficiently provisioned. While we see little credit risk at the moment but the Australian housing loan book remains an area that we are watching closely. Nonetheless, we think NAB’s decent earnings outlook and provision should greatly dampen such a risk.
Among the NAB’s AUD Tier 2 subordinated bonds (Table 1), We prefer NAB 5.000% 19Jan2032 Corp (AUD) given 1) our preference for shorter years to maturity/ call, and 2) attractive yields for its remaining time to maturity. That said, the bond might face liquidity issues given market conditions.
We also like NAB 6.322% 3Aug2032 Corp (AUD) and NAB 6.163% 09Mar2033 Corp (AUD). Despite slightly lower yield as compared to ANZ and Macquarie’s 2032 bonds, NAB’s 2032 and 2033 bond makes up for higher coupon and lower credit risk (indicative of lower OAS spread).
Under the Basel III framework for Tier 2 capital, Tier 2 securities that remain uncalled past the first reset date will have to be amortized in the balance sheet of the company. This also means that there is an incentive for the banks to call back on their Tier 2 subordinated bonds and to re-issue new Tier 2 bonds to ensure capital remains sufficient on their balance sheet.
We would like to remind investors that Tier 2 subordinated bonds are ultimately subjected to loss absorption upon a trigger, although the CET1 and AT1 instruments would be utilised first prior to the activation of Tier 2 securities for loss absorption.
Declaration: For specific disclosure, at the time of publication of this report, IFPL (via its connected and associated entities) and the analyst who produced this report holds a NIL position in the abovementioned securities.
Our podcast series, Yield Hunters, is available on Spotify, iTunes Podcasts and Google Podcasts. We share our thoughts on new bond issues and hold discussions on the fixed income space. Listen to our latest episode below and follow us!